
References
Home
Toolbar
Expressions
Time Format
Preferences
Import
Perl Import Filter
Perl Data Filter
Command Line
Inspectors
Attribute Inspector
Data Buffer
Data
MySQL
Curve Fit
Macro
Macro
Miscellaneous
Search
Legal Stuff
Warranty
Impressum
Privacy Policy
Attribute Inspectors
With the Attribute Inspector you can control every attribute of your document and data buffer.
General Inspector
This inspector controls some general attributes of your document.
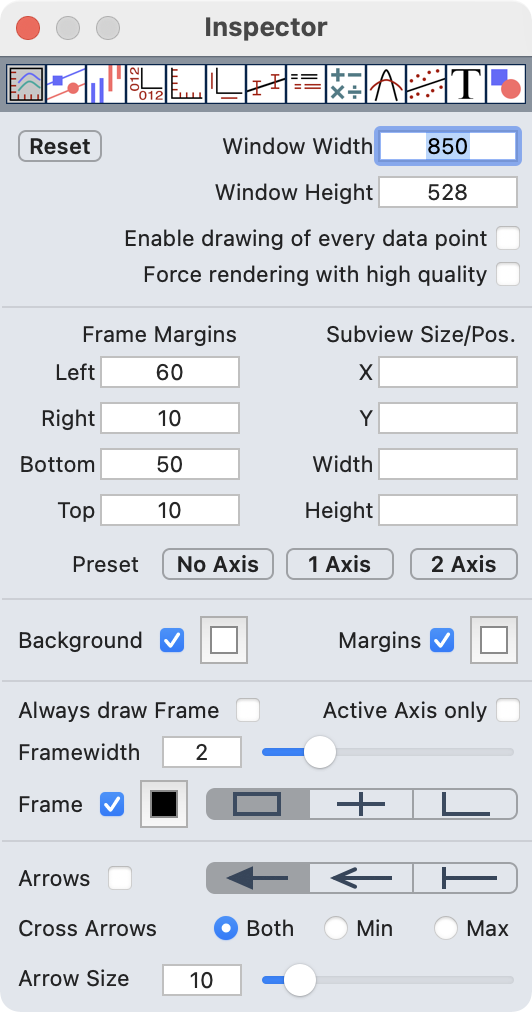
Enable drawing of every data point: If checked Plot draws always every data point. Typically Plot decides how many data points will be plotted and the result is reasonable. In some cases enabling this option can enhance your plot.
Force rendering with high quality: Plot automatically decides how to render your plot. Checking this option forces to render always in highest quality (which can dramatically slow down Plot on huge data sets).
Data Style Inspector
The Data Style Inspector controls the graphic attributes of each data buffer.
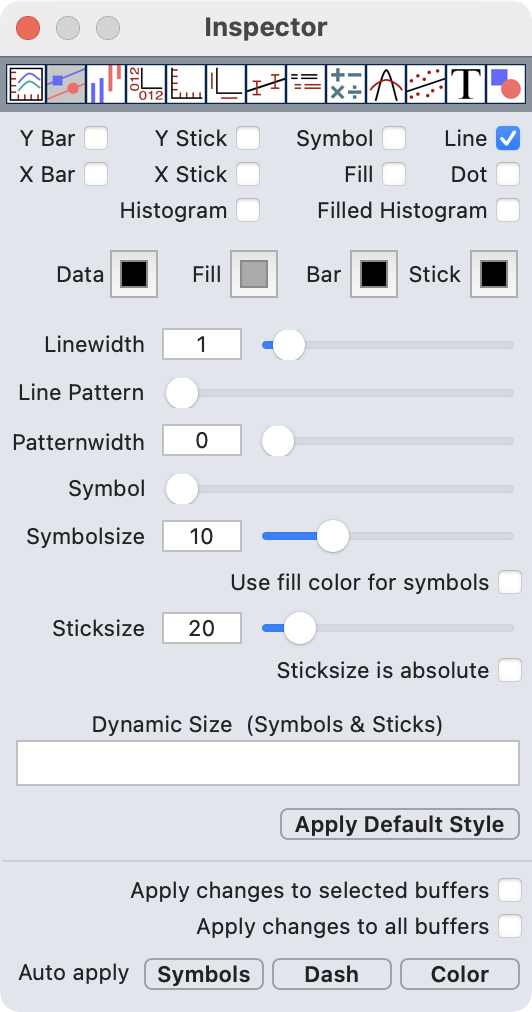
Use fill color for symbols: If checked symbols (0-6) will be filled with the fill color instead of the background color.
Sticksize is absolute: If checked the length of sticks is defined in the coordinate system of the plot. Together with the dynamic size field this allows very flexible stick length and symbol size.
Dynamic Size: Allows to enter an expression which defines the size of symbols or the length of sticks. The following special variables are available:
| x | x value |
| y | y value |
| ex | x error value |
| ey | x error value |
| bn | buffer number |
| np | number of buffers |
| np | number of datapoints |
| dp | the current datapoint |
Auto apply: This is a comfortable way to assign different styles automatically to all buffers, available for symbols, dash pattern and colors.
Extra Style Inspector
The Extra Style Inspector controls some advanced style attributes of each data buffer.
Free Scaled: This option allow to scale a buffer independent from the axis.
Dynamic Colors: Allows to enter an expression which defines the color of symbols and sticks (heat map). You can use up to 6 colors to define the color gradient. The color gradient has the range 0.0 - 1.0. You can also choose different rendering modes for color gradients. Example: If the symbols of your buffer should represent the y values of buffer 5 add the expression fny(x;5) (fny() returns a normalized y value of a buffer)
The following special variables are available:
| x | x value |
| y | y value |
| ex | x error value |
| ey | x error value |
| bn | buffer number |
| np | number of buffers |
| np | number of datapoints |
| dp | the current datapoint |
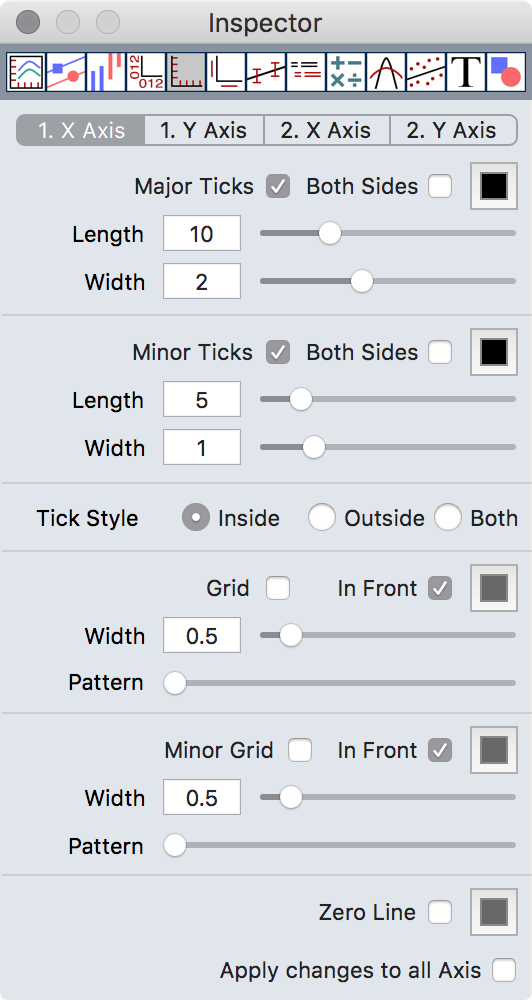
Axis Inspector
The Axis Inspector allows settings depending to the 4 available axis. The button at the top of the inspector selects on which axis the attributes below apply to.
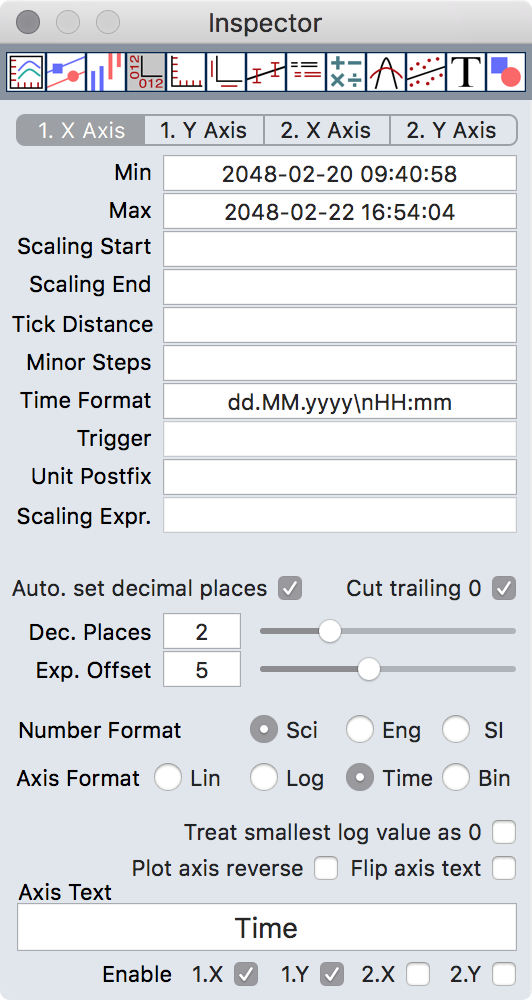
Min, Max: Controls the range of the axis. The range can also be changed with different mouse modes. Dependent on the number format you have to enter a number or a time value.
Scaling Start, Scaling End: Defines values where the scaling of the axis should start and stop. Dependent on the number format you have to enter a number or a time value.
Tick Distance: Defines the distance between two major ticks.
<n>y Defines the tick distance in years where n is the number of years (possible values: 1, 2, 5, 10, 20, 50, 100, 200, 500, 1000)
<n>m Defines the tick distance in month where n is the number of month (possible values: 1, 2, 3, 4, 6)
<n>w<s> Defines the tick distance in weeks where n is the number of weeks (possible values: 1, 2, 3, 4) and s is the start day of the week (0-6 where 0 is sunday)
Minor Steps: Defines the number of minor ticks between two major ticks.
Scaling Start, Scaling End, Tick Width, Minor Steps are optional values. If you leave the fields empty Plot calculates an optimal value automatically.
Time Format: Defines the format used for the displaying time values on time axis (time format tokens).
Trigger: This allow to define a trigger, a number where a tick should appear and all other ticks should depend on. Example: If you have an axis from 0 to 10 and you want ticks at 1.5, 3.5, etc. enter 1.5 in the trigger field.
Unit Postfix: Here you can add a unit postfix. This will be used if you have selected SI notation for your axis numbers.
Scaling Expr.: This allows scaling of axis numbers without changing the data itself. For example to display seconds instead of milliseconds enter v/1000 in this field. v is the variable which represents the axis number.
Automatically set decimal places: If checked the number of decimal places for axis numbers will be determind automatically.
Cut trailing zeros: This will cut trailing zeros from axis numbers. Works only if Automatically set decimal places is not checked.
Dec.Places: The number of decimal places for axis numbers.
Exp.Offset: Allows you to define the limit, above which numbers are plotted in exponential notation. The number you define with the slider is the exponent of the limit.
Axis Format: Here you can select between linear axis, logarithmic axis, time axis and binary axis.
Number Format: Change the format of axis numbers. Select between scientific notation, engineering notation and numbers with SI notation.
Treat smallest log value as 0: If check the smallest value on a logarithmic axis will be replaced with 0 (even if this is not correct).
Plot axis reverse: If check the axis will be plotted in reverse direction.
Axis Text: The major label for the axis. This field has limited formating possibilities. If you want a more sophisticated axis label use a text object together with the auto positioning option.
Flip axis text: If checked the axis text orientation will be flipped.
Enable: Allows to enable or disable an axis completely.
Axis Format Inspector
The Axis Format Inspector controls the graphic attributes of the 4 available axis. The button at the top of the inspector selects on which axis the attributes below apply to.
Axis Labels Inspector
The Axis Labels Inspector controls the axis label attributes and allows to assign arbitrary labels instead of the automatically generated numbers. The button at the top of the inspector selects on which axis the attributes below apply to.
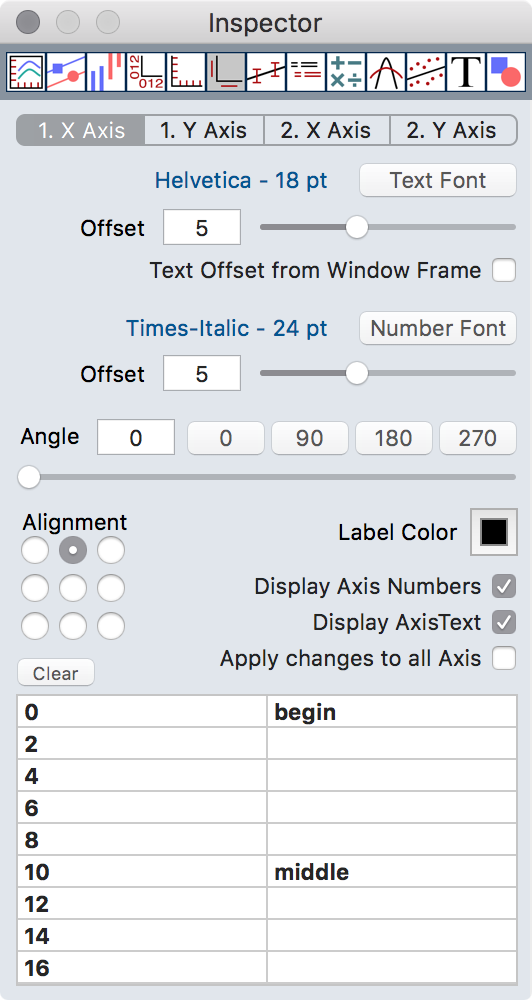
The table at the bottom with two columns shows on the left the numbers which are generated by Plot2. In the right column you can enter a replacement for the numbers. It is a good idea to do this after you have defined the desired range for the axis because changing the range can make your labels invisible.
Clear: deletes all labels for the currently selected axis.
Error Bars Inspector
The Error Bars Inspector controls the error bars for your data points.
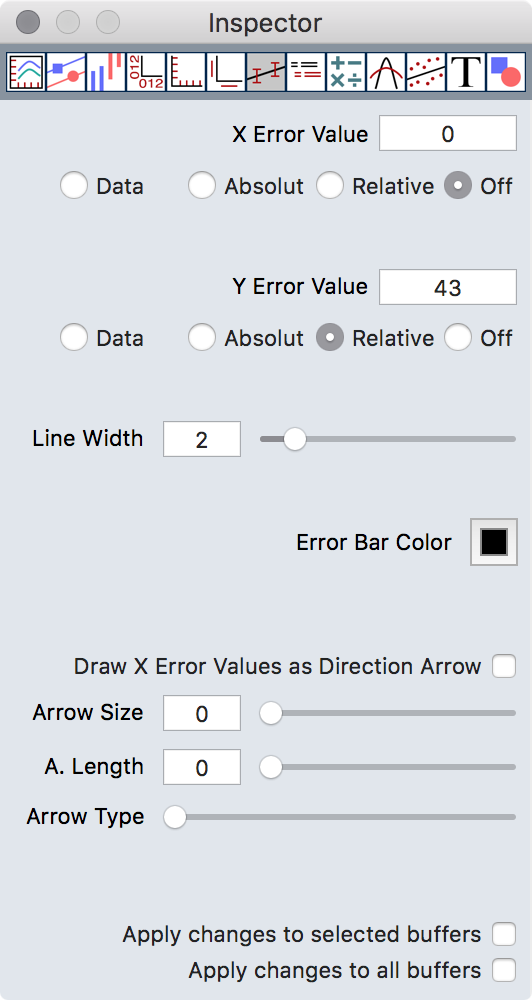
X Error Value, Y Error Value: Defines a value for errorbars. The radio button allows to switch between absolute, relative and individual data based error bars.
Draw X Error Values as Direction Arrow: If checked the X error values will be interpreted as directions in degrees. An arrow pointing to this direction will be drawn.
Legend Inspector
The Legend Inspector sets the attributes for the automatically generated legend.
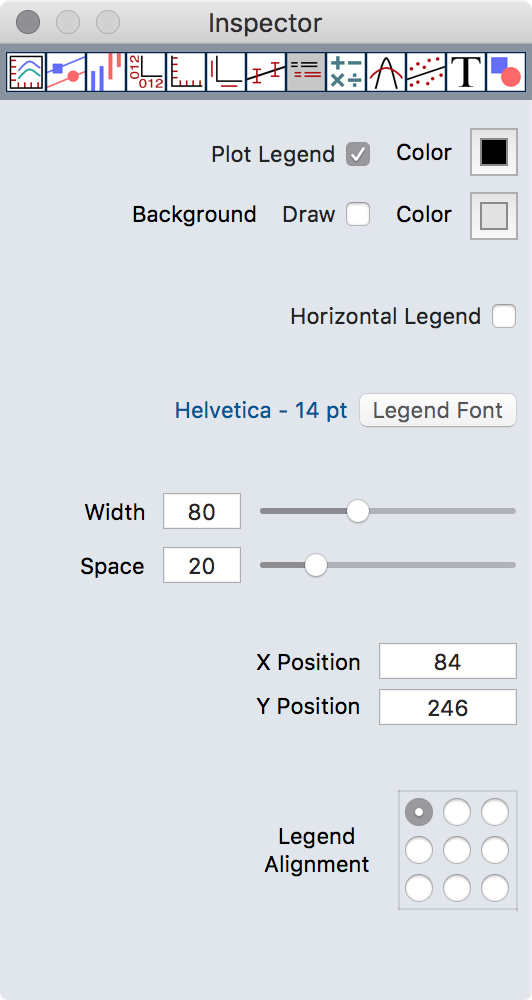
Only buffers with a checked L column in the Data Inspector appears in the legend.
Calculations Inspector
This inspector contains the function generator and the calculator which allows buffer calculations
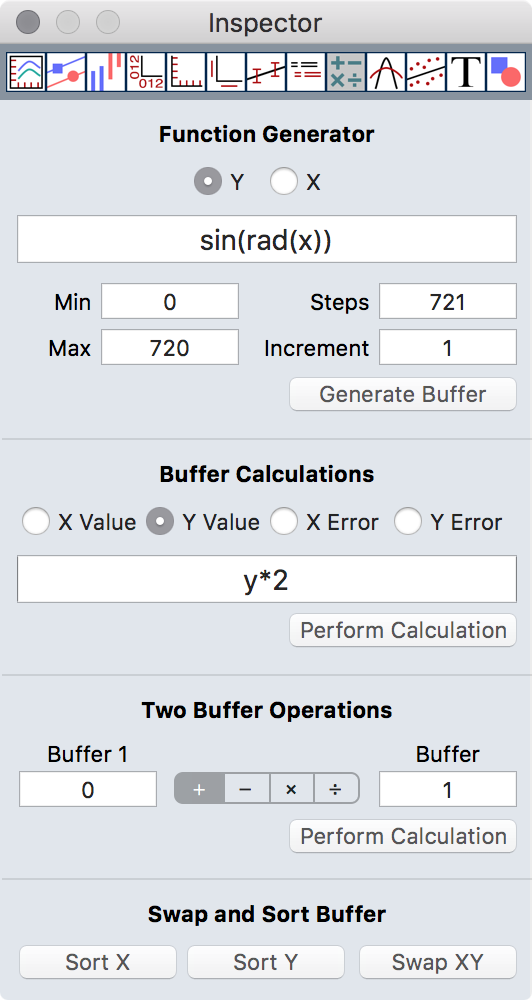
Function Generator
As the name implies the Function Generator allows to generate function plots from arbitrary expressions.
X, Y: Select the target. Enter the expression in the field below.
Min, Max: The range in which the expression should be calculated.
Steps, Increment: The number of steps which should be calculated. These two fields depends on each other; if you enter one the other one will be calculated automatically. The number of steps is limited to 1000000.
Buffer Calculations
The Buffer Calculation function allows to perform an arbitrary calculation on all selected buffers.
X Value, Y Value, X Error, Y Error: Select the target. Enter the expression in the field below.
Buffer Calculations allow the use of some special variables:
| x | x value |
| y | y value |
| ex | x error value |
| ey | x error value |
| bn | buffer number |
| nb | number of buffers |
| cb | number of the current buffers |
| np | number of datapoints |
| dp | the current datapoint |
Two Buffer Operations
Buffer 1, Buffer 2: The lower part of the calculation area allows to perform basic calculations between two buffers. This work also for buffers with different X axis and different numbers of data points. Only the overlapping area will be processed and missing points will be interpolated.
Swap and Sort Buffer
Swap XY: Clicking this button swaps the X and Y values in all selected buffers. Error values will also be swapped if available.
Sort X, Sort Y: Clicking this button sorts the data buffer by x values or by y values.
Normalize Inspector
With this inspector some manipulation of data like moving, normalizing etc. can be done.
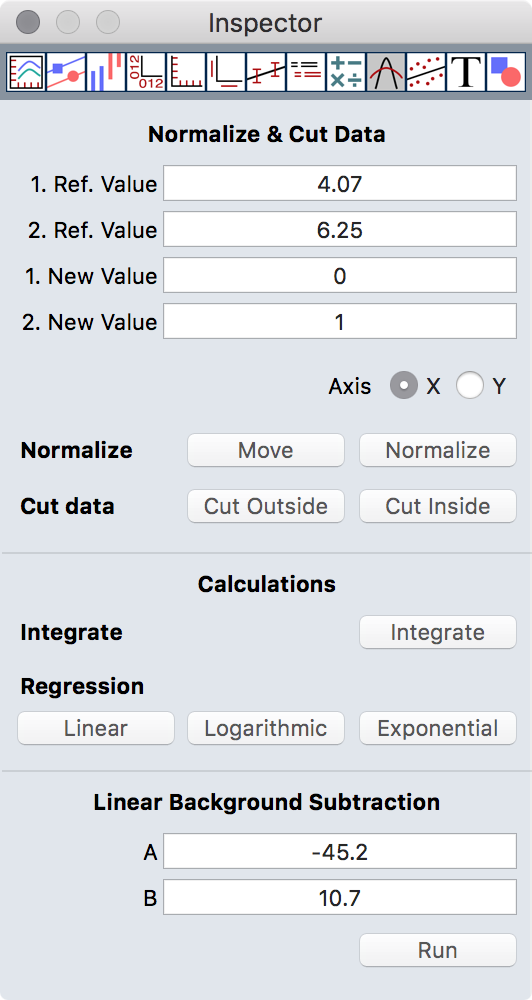
Normalize and Cut Functions
1. Ref. Value, 2. Ref. Value: Defines two values from either the X or the Y axis. These values can also defined with the normalize mouse modes.
1. New Value, 2. New Value: These values will only be used for the Normalize and Move function as new reference values.
Move: This function moves the selected buffers in the specified direction (selected with the Axis radio button) from the 1. reference to the 1. new value.
Normalize: This function manipulates the buffers by stretching or shrinking along the specified axis. The specified reference points in the data are changed in such a way that the 1. Ref. Value becomes the 1. New Value and the 2. Ref. Value becomes the 2. New Value.
Cut Outside: These function deletes all data points in all selected buffers which are not in the range between 1. Ref. Value and 2. Ref. Value.
Cut Inside: These function deletes all data points in all selected buffers which are in the range between 1. Ref. Value and 2. Ref. Value.
Calculations
Integrate: This function calculates the integral between X min (1. Ref. Value) and X max (2. Ref Value) and writes the result to the comment fields in the Data Inspector.
Regression: This function calculates the linear, logarithmic, or exponential regression between the X min (1. Ref. Value) and X max (2. Ref. Value) and generates a new buffer with the result. The following functions will be used:
Linear


Logarithmic

Exponential

Linear Background Subtraction
This function subtract a linear background from your data (y=y-a-bx). The reference values a and b can be set with the mouse mode Linear Background.
Fit Inspector
With this inspector some mathematical manipulation of data can be done.
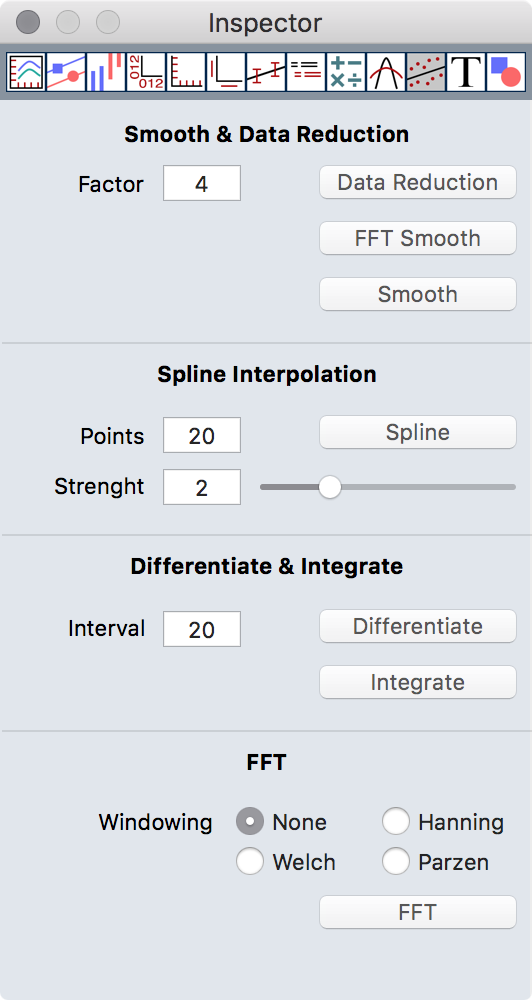
Smooth & Datareduction
Data Reduction: Sometimes it is useful to reduce a large number of data points which consist mainly of noise to a more practical amount of points. This function takes n points (n is specified in the Factor field), builds the average, and replaces the n points with the new one.
FFT Smooth: This functions uses as effective smooth width the value from the Factor field and performs a FFT based smooth to reduce the noise on the buffer.
Smooth: This functions uses as effective smooth width the value from the Factor field and performs a least square smooth to reduce the noise on the buffer.
Spline Interpolation
This function calculates a nonparametric cubic spline interpolation for all selected buffers.
Points: Defines the number of points which should be calculated for each interval.
Strength: Defines the strength of the interpolation. 2 is in most cases a god choice.
Differentiate & Integrate
This function allow to differentiate and integrate buffers.
Interval: This the effective interval which will be used to calculate the differentiation.
Differentiate: Differentiate all selected buffer and generate new buffers with the result data.
Integrate: Integrates all selected buffer and generate new buffers with the result data. The integrate function does not need the interval.
FFT (Fast Fourier Transform)
This function makes a Fast Fourier Transform for all selected buffers.
Text Inspector
This inspector controls the graphical attributes of text objects.
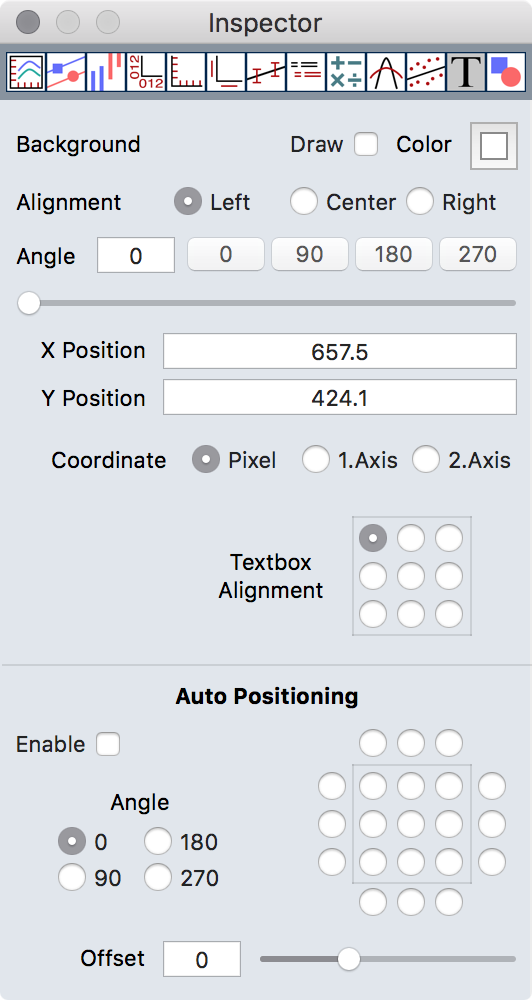
Coord.Sys.: Defines the coordinate system to which the text object belongs. This allows text with a fixed position in the window and also text which floats with the data.
Textbox Alignment: Defines the alignment of the enclosing frame of a text object.
Auto Positioning: This option allow to give a text a fixed position inside your plot. The button matrix on the right selects the position relative to the plot frame.
Graphic Inspector
This inspector controls the graphical attributes of graphic objects. Currently lines, arrows, rectangle, and circles are supported.
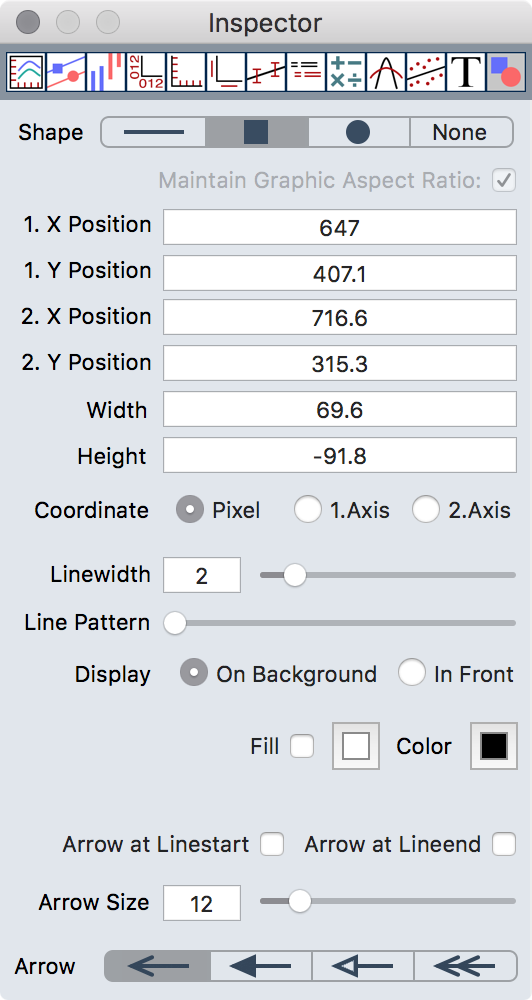
Maintain Graphic Aspect Ratio: If checked the size of imported graphics can only changed accordingly the image proportions.
Background: Enables or disables background drawing for rectangles and circles.
Coord.Sys.: Defines the coordinate system to which the graphic object belongs. This allows graphics with a fixed position in the window and also graphics which floats with the data.